
Manufacturing generates enormous volumes of data every day – yet most of it is only evaluated in hindsight: reports show what happened yesterday, dashboards show why a line stopped. Predictive analytics turns that view forward. Instead of documenting the past, the approach predicts future events and metrics from operational data – from an impending machine failure to the scrap rate and the energy demand of the next shift. As part of the industrial AI movement, predictive analytics combines continuous data acquisition, historical trends and machine learning. This article explains what predictive analytics is, how it differs from prescriptive analytics and how to implement it step by step on the factory floor.
What is predictive analytics?
Predictive analytics is the data-driven prediction of future events or metrics based on historical and current operational data. A model learns from past patterns – such as the typical progression before a bearing failure – and transfers that knowledge to the present to deliver a well-founded forecast. The core question is not “what happened?” but “what will probably happen?”.
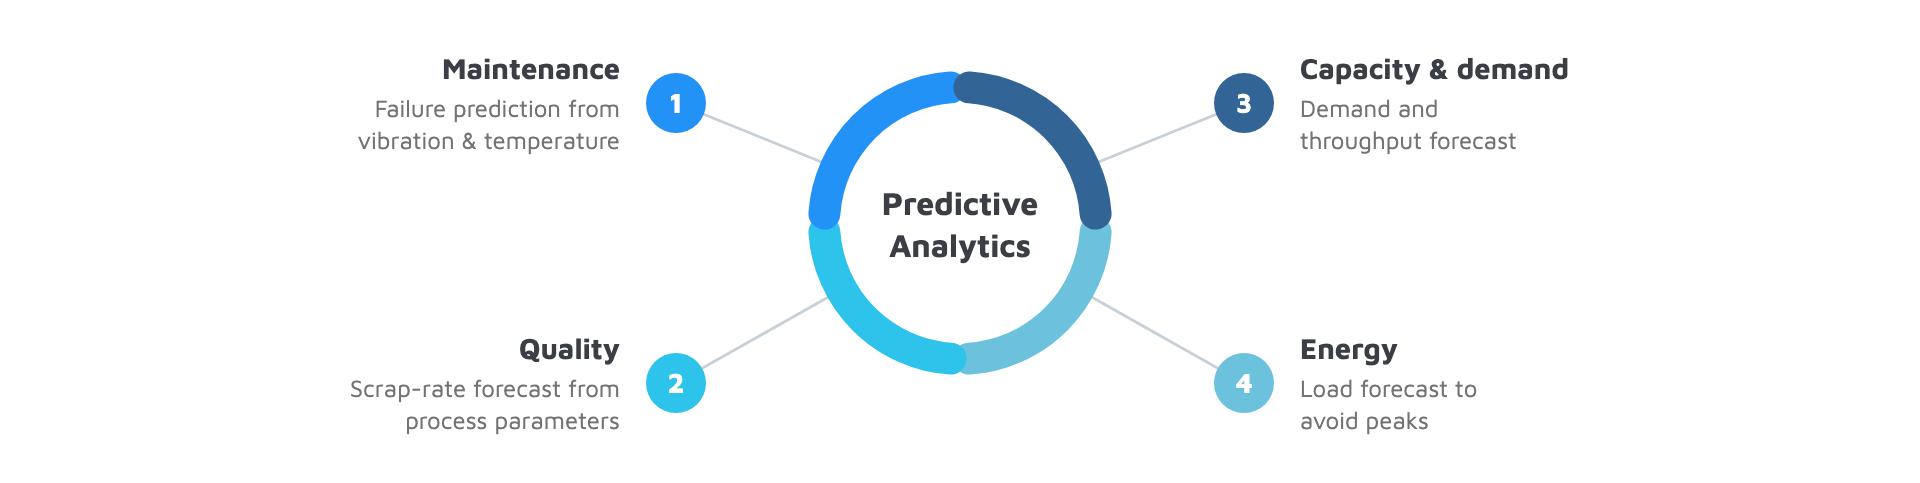
In manufacturing there are numerous concrete use cases. They differ in their data sources and models, but follow the same basic principle:
- Maintenance: Prediction of machine failures from vibration, temperature or current draw – the best-known use case, also referred to as predictive maintenance.
- Quality: Forecasting scrap or rework from process parameters, before a defective part is even produced.
- Capacity and demand: Predicting throughput, utilization or material demand for better scheduling of shifts and inventory.
- Energy: Forecasting energy consumption to avoid load peaks and reduce costs.
The tool behind these predictions is usually machine learning. The range spans from simple regression through classification to specialized time-series models. What matters, however: a model is only ever as good as the data it is trained and operated on. As with every industrial AI initiative, that puts data acquisition at the center of every predictive analytics solution.
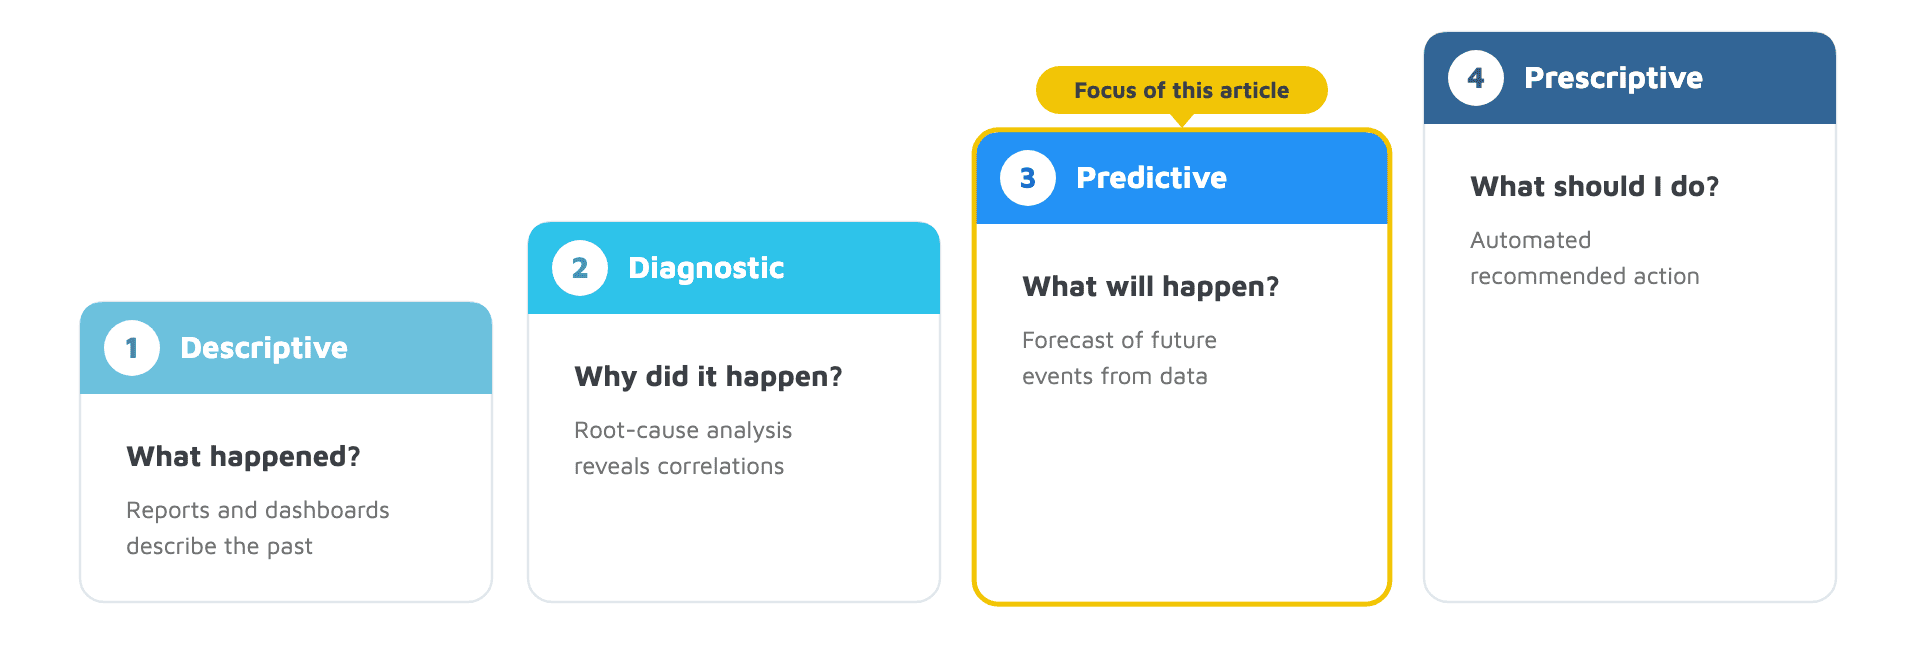
Descriptive, predictive, prescriptive: the four stages of analytics
To place predictive analytics cleanly in context, the established model of the four analytics stages helps (see graphic above). Each stage answers a different question and delivers greater value – but also requires more data and maturity:
- Descriptive analytics – “What happened?” Retrospective evaluation: reports and dashboards that describe past states.
- Diagnostic analytics – “Why did it happen?” Root-cause analysis that reveals the correlations and triggers behind an event.
- Predictive analytics – “What will happen?” Prediction of future events and metrics from historical patterns.
- Prescriptive analytics – “What should I do?” Derivation of concrete, often automated recommendations for action from the forecast.
The difference between predictive and prescriptive analytics
Both stages look into the future, but pursue different goals. Predictive analytics forecasts – it delivers a probability or a value, but leaves the decision to the human. Prescriptive analytics goes one step further and recommends a concrete action based on that forecast, often supported by optimization methods and partly automated.
An example from manufacturing makes the difference tangible. On a drive motor, a bearing fault runs through all four stages: descriptive analytics reports that the bearing temperature was elevated yesterday. Diagnostic analytics recognizes that the increase correlates with rising vibration. Predictive analytics forecasts that the bearing will fail in about 12 operating days. Prescriptive analytics finally recommends scheduling the replacement for next Thursday, because a stoppage is planned then anyway and the spare part is available. In practice, a reliable forecast is almost always the prerequisite for meaningful recommendations – which is why predictive analytics is the decisive building block on the way to the prescriptive stage.
Prerequisite: data as the foundation
Predictive analytics stands or falls with data quality. A predictive model needs continuous, clean and contextualized operational data – over weeks and months, from different sources and in a consistent format. This is exactly where the real hurdle lies in many factories: the data exists, but it is trapped in isolated systems (PLC, SCADA, historian) and inconsistently structured.
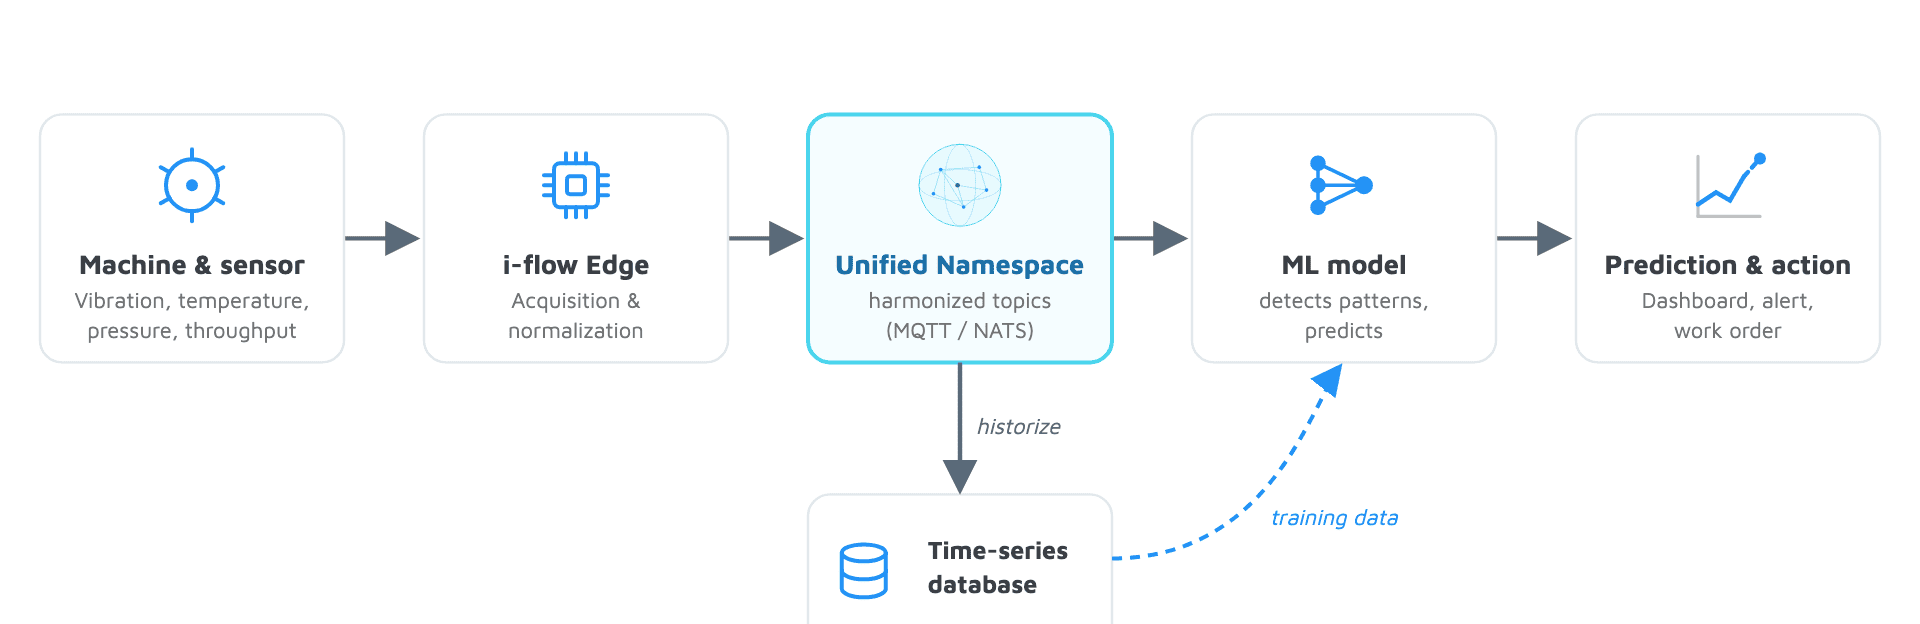
The Unified Namespace (UNS) addresses this problem. It forms a central, hierarchically organized data layer in which all systems publish and consume data through a shared message broker – such as MQTT or NATS. This makes machine data available – normalized and in real time – as a Single Source of Truth (SSOT). For predictive analytics this means: a model does not have to connect to a dozen proprietary interfaces, but simply subscribes to the relevant topics in the UNS.
Historization is equally important. Models are trained on historical data, especially on the periods around past events such as failures or quality deviations. A time-series database stores these trends long term and provides the training basis. The UNS and historization thus form the foundation on which every predictive approach is built.
Implementing predictive analytics
Start step by step – not factory-wide, but on a clearly defined use case. These five steps form a proven path to production-ready predictive analytics.
- Define the prediction question and target metric: Start with a concrete question, not the technology: what should be predicted – a bearing failure, a batch’s scrap rate, the energy demand? Define which metric it should improve and how you measure success.
- Connect the relevant data sources: Connect the signals that announce the predicted state. Many already come from existing controllers via native protocols such as
OPC UA,ModbusorSiemens S7; where variables such as vibration are missing, additional sensors complete the data basis. - Normalize the data and publish it to the UNS: Standardize units, timestamps and naming conventions and publish the data to a consistent ISA-95 topic structure, for example
plant01/assembly/line01/motor01/vibration. This harmonization lets a model use the data reliably in the first place. - Historize and choose the simplest model: Write the UNS data to a time-series database and start with the simplest viable model. Often rule-based or anomaly detection suffices at first; complex forecasting models follow once enough historical data exists.
- Operationalize the predictions: A forecast only takes effect when it flows back into a process – as a control-room alarm, a dashboard KPI or an automatically generated work order. Where it pays off, this is the transition to the prescriptive stage: the forecast becomes a concrete recommendation.
The process is iterative: a first model is rarely perfect. Gather experience, refine the models, then extend the approach. Beware “model drift” – as processes, materials or machines change, accuracy declines and models need retraining.
Benefits and limits of predictive analytics
Predictive analytics is neither an end in itself nor a cure-all. Like any data-driven approach, it brings clear benefits, but also real limits. An honest assessment is the prerequisite for an economically sound rollout.
Benefits
- From reacting to planning ahead: Events are detected before they occur – creating time for planned action instead of expensive ad-hoc responses.
- Better planning: Maintenance, staff, material and energy can be scheduled proactively on the basis of reliable forecasts.
- Data-driven decisions: Decisions rely on objective patterns in the operational data rather than on experience or gut feeling.
- Foundation for prescriptive analytics: Reliable forecasts are the prerequisite for automated recommendations in the next stage of maturity.
Limits
- High initial effort: Data acquisition, UNS connection and historization have to be built up first. Without this foundation, every prediction remains unreliable.
- Dependence on historical data: Models need enough examples from the past. Where these are missing – for new assets, for instance – anomaly detection is the more pragmatic starting point.
- Ongoing model maintenance: Models must be monitored and retrained regularly, otherwise their accuracy declines through model drift.
- Not economical everywhere: For non-critical processes the effort can exceed the benefit – a simple evaluation is then sufficient.
The consequence of this assessment: predictive analytics pays off most where events are expensive, announce themselves in the data and enough history is available. A targeted start on such use cases is therefore economically more sensible than a factory-wide rollout.
i-flow as the data foundation for predictive analytics
Because predictive analysis is first a data problem, the lever lies in a reliable data basis. The i-flow platform provides exactly this foundation and follows a clear principle: central configuration in the i-flow Hub, decentralized execution via i-flow Edges close to the machine.
The i-flow Edge connects directly to PLCs, sensors and SCADA systems via native protocols such as OPC UA, Modbus or Siemens S7. It normalizes the raw data locally – close to the source, with minimal latency – and publishes it in structured form to the UNS. The i-flow Hub manages data models and connections centrally and rolls out changes consistently to all Edges. The i-flow Broker provides the central message broker and ensures reliable delivery of all data points.
For predictive analytics this means, in concrete terms: the harmonized data is available in the UNS, and any analytics or AI system can subscribe to it as a consumer – without worrying about protocol details or proprietary interfaces. Data analysis can thus focus on the models instead of on data acquisition.
Conclusion
Predictive analytics shifts the view in manufacturing from hindsight to foresight. It detects future events from real operational data and thereby creates the room to act that descriptive and diagnostic evaluations lack. It differs clearly from the prescriptive stage: predictive analytics forecasts, prescriptive analytics recommends the action – and builds on the forecast to do so.
What matters, however, is the right order. Predictive analytics is not a pure AI topic, but first a data topic. Without continuous, harmonized and historized data, even the best model remains ineffective. Three key takeaways:
- Data before models: A solid data foundation – ideally a Unified Namespace – is the prerequisite, not an afterthought.
- Step by step instead of factory-wide: Start on a clearly defined use case, gather experience and extend the approach afterwards.
- Prediction before action: Predictive analytics is the basis on which prescriptive analytics and automated decisions become possible in the first place.
Whoever lays the data foundation today creates the basis not only for predictive analytics, but for further industrial AI applications across the entire plant.